
Machine-Learning media bias
Authors
Samantha D'Alonzo, Max Tegmark
Abstract
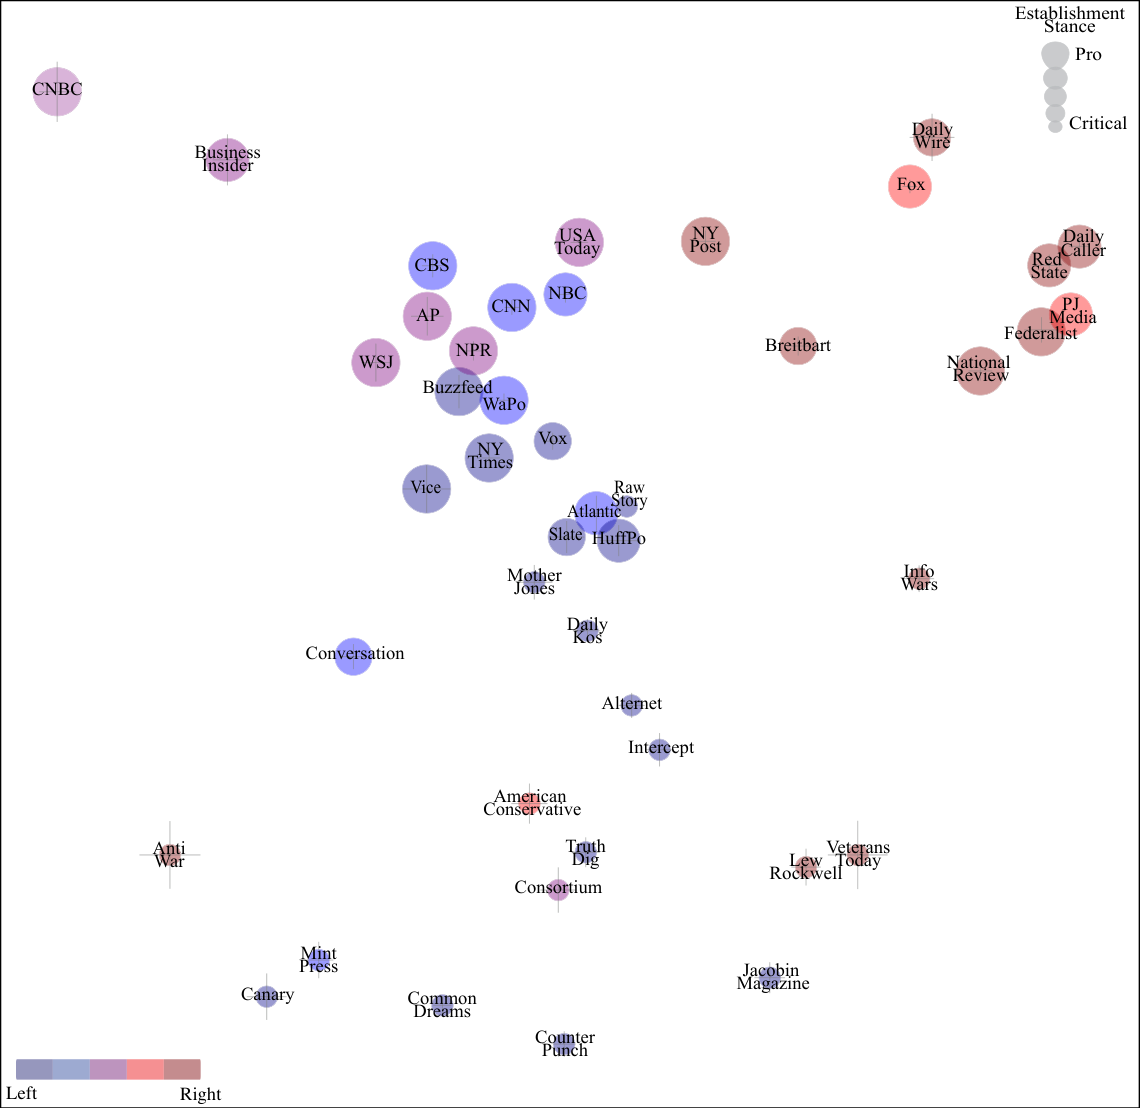
We present an automated method for measuring media bias. Inferring which newspaper published a given article, based only on the frequencies with which it uses different phrases, leads to a conditional probability distribution whose analysis lets us automatically map newspapers and phrases into a bias space. By analyzing roughly a million articles from roughly a hundred newspapers for bias in dozens of news topics, our method maps newspapers into a two-dimensional bias landscape that agrees well with previous bias classifications based on human judgement. One dimension can be interpreted as traditional left-right bias, the other as establishment bias. This means that although news bias is inherently political, its measurement need not be.
Concepts
The Big Picture
Imagine you’re handed a random newspaper clipping with no masthead, no byline, no date. Could you tell just from the words whether it came from Fox News or MSNBC? From a scrappy independent outlet or an establishment broadsheet? Most people can make a pretty good guess, and it turns out a machine can too, with surprising accuracy.
Political polarization is accelerating in the United States and abroad, and media is increasingly implicated as a driver. But measuring media bias objectively has always been a thorny problem: any person or organization tasked with judging bias is themselves subject to accusations of the same. Fact-checkers get called partisan. Bias-raters get dismissed.
Samantha D’Alonzo and Max Tegmark at MIT’s Department of Physics and IAIFI offer a simple idea: let the language itself reveal the bias. They use machine learning to discover structure in news articles that no human pre-labeled.
By training a model to predict which newspaper published an article based purely on phrase frequencies, the researchers uncovered a two-dimensional bias map. It captures both left-right and establishment dimensions, matches human expert classifications, and requires no human opinion as input.
How It Works
Take roughly a million articles from about a hundred newspapers. For each article, don’t analyze topic, sentiment, or meaning in any deep sense. Just count phrases.
Consider how newspapers diverge on politically charged word choices:
- “Undocumented immigrant” vs. “illegal immigrant”
- “Demonstrators” vs. “rioters”
- “Estate tax” vs. “death tax”
These phrase frequency signatures (numerical fingerprints based on which words appear and how often) are the raw material.
The team frames the problem as a classification task: given an article’s phrase counts, predict which of the ~100 newspapers published it. But they don’t actually care about getting the classification right. What matters is the conditional probability distribution, the statistical pattern the model builds to tell one newspaper from another. Those learned patterns are the signal about bias.
The method centers on a generalized Singular Value Decomposition (SVD), which compresses thousands of phrase-count columns down to just two or three dimensions. Standard SVD fails here for two reasons: it can produce nonsensical negative phrase counts, and it treats all observations equally even when some phrase counts are measured far more precisely than others.
D’Alonzo and Tegmark instead maximize a Poisson likelihood. Word counts are discrete events, exactly the kind of data the Poisson distribution was built for. The method tests two parameterizations (a ReLU, which floors negative values to zero, and an exponential form) and selects whichever fits the data better.
The algorithm maps both newspapers and phrases into a low-dimensional bias space, a compact coordinate system where publications with similar language patterns cluster together. No human tells it what the axes mean; it discovers structure from the data alone.
When the researchers examine those axes, one maps cleanly onto the traditional left-right political spectrum. The other captures what they call establishment bias: how much a publication aligns with or challenges mainstream institutional narratives, independent of left-right positioning.
Why It Matters
This purely data-driven method recovers the same two-dimensional structure that human experts have identified through years of qualitative analysis. Left-right bias and establishment bias emerge not because the researchers encoded those categories, but because those are genuinely the dominant axes along which newspapers differ in their word choices. The machine didn’t need to be told about politics. Politics showed up anyway, baked into the language.
The practical upside is real-time, scalable bias monitoring. The method is fully automated and relies only on publicly available text, so it can run on new outlets, new topics, and new time periods without additional human labeling. The team analyzes dozens of distinct news topics and finds that biases are correlated across them in consistent ways, which is what allows the two-dimensional structure to emerge.
The same approach could extend to other languages, to tracking how newspaper bias shifts over time, or to social media, political speeches, and corporate press releases.
Machine learning can measure media bias from phrase statistics alone, no human labels required. The resulting bias map matches expert classifications while being far more reproducible than any human-driven alternative.
IAIFI Research Highlights
This work applies physics-inspired mathematical tools (Poisson likelihood maximization and generalized SVD) to a social science problem, bringing quantitative rigor to the study of media institutions.
The paper introduces an unsupervised NLP method that discovers interpretable bias dimensions from a million-article corpus, with no hand-crafted features or human-labeled training data.
Political polarization structures (left-right and establishment axes) emerge automatically from language statistics, showing that ideological divisions leave measurable fingerprints in word choice.
Future extensions could track bias evolution over time or across languages. The paper is available at [arXiv:2109.00024](https://arxiv.org/abs/2109.00024).
Original Paper Details
Machine-Learning media bias
2109.00024
Samantha D'Alonzo, Max Tegmark
We present an automated method for measuring media bias. Inferring which newspaper published a given article, based only on the frequencies with which it uses different phrases, leads to a conditional probability distribution whose analysis lets us automatically map newspapers and phrases into a bias space. By analyzing roughly a million articles from roughly a hundred newspapers for bias in dozens of news topics, our method maps newspapers into a two-dimensional bias landscape that agrees well with previous bias classifications based on human judgement. One dimension can be interpreted as traditional left-right bias, the other as establishment bias. This means that although news bias is inherently political, its measurement need not be.